
In this article: what KPI definition inconsistency is, seven common causes, the hidden business costs, a six-step standardisation framework, examples of KPIs that need consistent rules, why a dashboard alone can't fix the problem, and what to look for in a solution.
Imagine managing five warehouses across two regions. Every Monday, you receive a performance report from each location. All five reports contain familiar measurements: order fulfilment rate, inventory accuracy, picking productivity, dispatch turnaround, and labour utilisation.
The problem appears when you compare them.
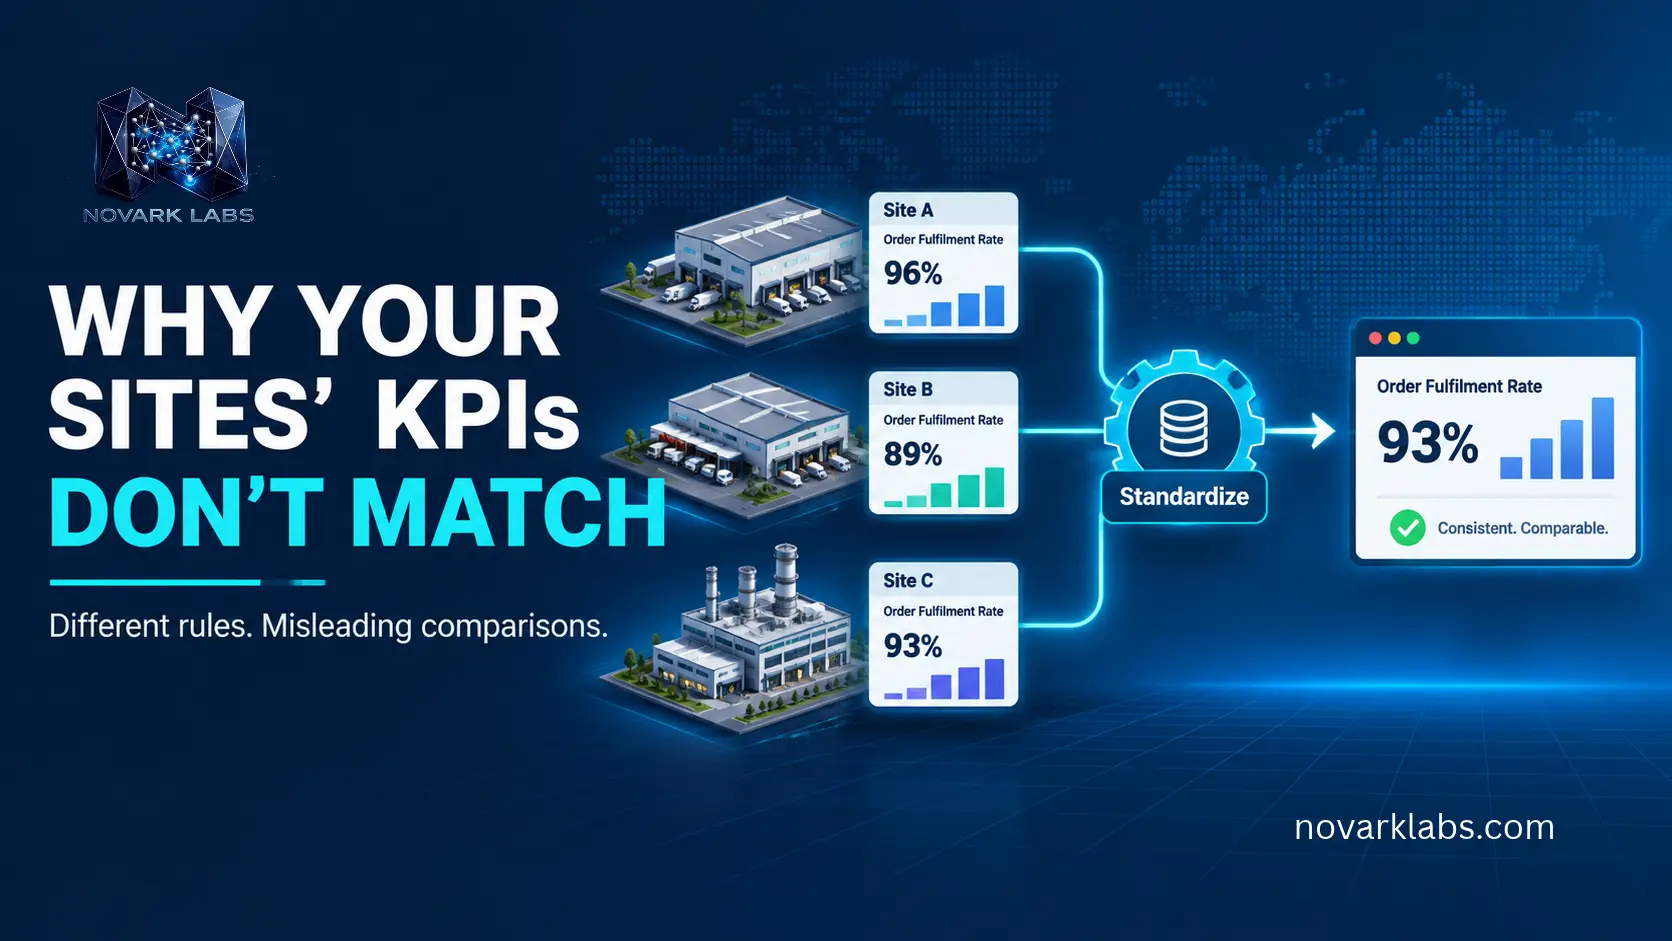
(Illustrative example.) One warehouse reports an order fulfilment rate of 96%. Another reports 89%. A third claims 93%. At first glance, the first warehouse looks like the strongest performer. But what if each facility calculates order fulfilment differently?
One location counts an order as fulfilled when it is picked. Another counts it only after packing and dispatch. A third excludes orders delayed by stock shortages. Suddenly, those percentages are no longer directly comparable.
This is one of the most overlooked problems in multi-site operations: different facilities can use the same KPI name while measuring completely different things.
The consequences extend far beyond inaccurate reports. Inconsistent calculation rules can lead to poor resource allocation, misleading performance rankings, incorrect improvement targets, unnecessary operating costs, and decisions based on data that looks consistent but is not.
For growing manufacturing groups, logistics companies, warehouse networks, and industrial businesses, multi-site KPI standardisation is essential to achieving meaningful operational visibility.
A central dashboard cannot solve the problem if the numbers feeding it are calculated differently. Before comparing performance across locations, businesses must establish consistent definitions, calculation methods, reporting periods, and data rules.
This article explores why site KPIs fail to match, the hidden business costs of inconsistent calculations, and how organisations can establish a reliable framework for cross-site performance benchmarking.
What Does It Mean When Different Sites Have Different KPI Calculation Rules?#
A key performance indicator (KPI) is a measurable value used to evaluate how effectively a business, department, facility, or process is achieving a specific objective.
Common operational KPIs include:
Production output per shift
Overall Equipment Effectiveness (OEE)
Order fulfilment rate
Inventory accuracy
Picking productivity
On-time delivery
Equipment downtime
Labour utilisation
Dock dwell time
Order processing cycle time
These indicators help management understand operational performance and identify areas that need attention.
However, a KPI is only useful when everyone understands what it measures and how its value is calculated.
Consider two facilities reporting machine availability. Both use the same KPI name, but one includes planned maintenance in downtime while the other excludes it. Their results may be mathematically correct according to their local rules, yet the comparison is misleading.
This is called KPI definition inconsistency.
It occurs when locations use different:
Formulas and calculation methods
Data sources and transaction records
Inclusion and exclusion criteria
Shift start and end times
Reporting intervals
Units of measurement
Exception classifications
Rules for incomplete or delayed transactions
The problem becomes particularly difficult when businesses operate different ERP, WMS, SCADA, or locally developed systems across their facilities.
Each system may record operational events differently. Without a shared calculation framework, consolidating the results does not automatically make them comparable.
Multi-site KPI standardisation means establishing one agreed measurement framework and applying it consistently across locations, while preserving the operational context that makes each facility different.
Why Your Sites' KPIs Don't Match: Seven Common Causes#
KPI inconsistencies rarely appear overnight. They usually develop gradually as individual facilities create reporting processes to meet their immediate operational needs.
A spreadsheet is introduced to track productivity. A local manager changes the formula to reflect a different workflow. Another facility adopts a new WMS. Eventually, the organisation has several reporting methods that share terminology but not measurement logic.
Here are seven common causes.
1. Different Definitions of the Same KPI#
The first source of inconsistency is often a difference in definition.
Take order fulfilment rate. One warehouse may define a fulfilled order as an order that has been picked. Another may require picking, packing, and dispatch confirmation.
Both facilities can report an order fulfilment percentage, but they are measuring different stages of the process.
A business might define fulfilment rate as:
Order fulfilment rate = Orders fulfilled ÷ Total eligible orders × 100
The formula appears straightforward. However, the important question is what qualifies as a fulfilled order and which orders are eligible for inclusion.
Does a partially fulfilled order count? What about cancelled orders? Are orders awaiting customer confirmation included? Does the reporting period use order creation date or dispatch date?
Without shared answers, the same KPI can produce different results.
2. Different Inclusion and Exclusion Rules#
Even when facilities agree on a KPI definition, their exclusion rules may differ.
For example, two manufacturing plants may calculate equipment downtime. One includes all machine stoppages. Another excludes scheduled maintenance, planned cleaning, and breaks.
These decisions can materially change the final availability figure.
A similar issue occurs in warehouse operations. One site may exclude damaged-stock orders from its fulfilment calculation, while another includes them. One location may exclude customer-requested delivery changes from on-time delivery reporting, while another does not.
Exclusions are not inherently wrong. Operational circumstances sometimes require them.
The problem is applying different exclusion rules without documenting or controlling them.
A reliable multi-site KPI standardisation framework records which events are included, which are excluded, why they are excluded, and whether the same rule applies across every facility.
3. Different ERP, WMS, and Operational Systems#
Multi-site businesses do not always operate identical technology.
One warehouse might use SAP. Another may run a different WMS. A third could rely on a locally developed inventory database and spreadsheets.
Manufacturing facilities may use different SCADA configurations, production tracking systems, or machine data sources.
These systems may record similar events using different field names, statuses, timestamps, or transaction structures.
For example:
One WMS records an order as complete after the final pick confirmation.
Another records completion after packing.
A third records completion after dispatch.
A local spreadsheet may use a manually updated status.
If all these values are sent directly into a central report without transformation, the resulting KPI may combine incompatible information.
The solution is not necessarily to replace every local system. A better approach can be to connect the existing platforms, map their data into a common structure, and apply standard calculation rules centrally.
4. Different Shift Timings and Reporting Periods#
Time-based differences can make site performance appear inconsistent even when underlying processes are similar.
Imagine two plants that both report "daily output." Plant A counts a day as midnight to midnight, while Plant B counts the shift that starts at 10:00 PM as belonging to the day it ends. Both submit figures at the same time each morning, but the numbers cover different 24-hour windows.
The same problem occurs when facilities operate across time zones or use different calendar conventions.
For example, a warehouse operating from 10:00 PM to 6:00 AM must decide whether its output belongs to the calendar day when the shift starts or the day when it ends.
These decisions influence production output, labour productivity, dispatch performance, and downtime reporting.
A consistent reporting framework should define the reporting timezone, shift boundaries, cut-off times, and treatment of overnight operations.
5. Different Units of Measurement#
Unit differences can create misleading comparisons when they are not converted consistently.
A logistics business might track throughput in tonnes per hour at one depot and kilograms per hour at another. A manufacturing group might record production in pieces at one plant and batches at another.
Inventory measurements can also differ. One facility may use individual units, while another reports cartons, pallets, or kilograms.
Before comparing results, the data must be converted into an agreed unit or a clearly defined equivalent measurement.
This requires more than changing the label on a dashboard. Conversion factors must be accurate, documented, and appropriate for the material or product being measured.
For example, carton quantities may vary by SKU. Applying one general carton-to-unit conversion across every product could create another source of inaccurate reporting.
6. Manual Spreadsheet Changes and Local Reporting Habits#
Spreadsheets are useful operational tools. They allow teams to track information, investigate exceptions, and create quick reports.
However, manually maintained spreadsheets can become a source of KPI inconsistency when each site develops its own formulas and reporting habits.
Common problems include:
Different formula versions across locations
Manually overwritten cells
Hidden rows or filters
Inconsistent date formats
Duplicate transaction records
Missing data entries
Unrecorded changes to calculation logic
A formula may be corrected at one facility but not updated elsewhere. Another location may introduce an additional column that changes the calculation without informing the central reporting team.
Over time, multiple versions of the same report circulate across the organisation.
The result is a reporting environment in which managers spend more time checking whether the numbers are correct than interpreting what those numbers mean.
7. Different Data Refresh Frequencies#
Two sites may use identical formulas but still report different operational conditions because their data updates at different times.
For example, Site A synchronises WMS transactions every few minutes. Site B exports data once every evening. Site C updates its operational spreadsheet manually at the end of each shift.
A central dashboard may display all three figures together, but the data does not represent the same point in time.
This is a data latency problem.
Businesses should measure the time between an operational event and its appearance in the consolidated reporting environment. Data freshness should be visible so that managers understand whether they are looking at live information, a recent snapshot, or an older report.
The Hidden Business Cost of Inconsistent KPI Calculations#
Inconsistent KPIs create costs that are often difficult to identify because they are spread across management time, operational decisions, inventory, staffing, and reporting processes.
The organisation may believe it has a performance problem at one site when the real issue is a calculation difference.
1. Management Makes Decisions Based on Misleading Comparisons#
(Illustrative example.) Suppose a regional manager compares three warehouses:
| Warehouse | Reported picking productivity |
|---|---|
| Site A | 110 lines/hour |
| Site B | 96 lines/hour |
| Site C | 102 lines/hour |
Site A appears to be the most productive.
However, Site A counts every scanned line, including lines later reversed or corrected. Site B counts only successfully completed picks. Site C excludes replenishment delays.
The ranking does not reflect a consistent measurement.
Management may direct improvement resources towards Site B even though the apparent performance gap is partly caused by reporting rules.
Reliable cross-site performance benchmarking requires consistent calculations before managers draw conclusions from rankings.
2. Operational Improvements Are Directed at the Wrong Problems#
When KPI differences are not understood, businesses can spend time fixing problems that do not actually exist.
A plant may appear to have poor OEE because its downtime calculation includes maintenance periods that other plants exclude.
A warehouse may appear to have slow dispatch turnaround because its clock starts when an order is released rather than when the vehicle reaches the dock.
Management could introduce new procedures, additional supervision, or expensive equipment based on a misleading interpretation of the data.
Standardised KPI definitions help distinguish genuine operational weaknesses from measurement differences.
3. Inventory and Capacity Decisions Become Less Reliable#
Inconsistent reporting affects more than performance reviews.
Imagine a distribution network with four warehouses. One site reports available inventory based on physical stock. Another includes stock allocated to open orders. A third uses a last-synchronised inventory figure.
A regional manager reviewing these figures may believe a particular warehouse has enough stock to fulfil demand.
But some of that inventory may already be committed, unavailable, or no longer physically present.
The same issue affects capacity planning. If sites calculate available capacity using different assumptions about labour, equipment, operating hours, or storage constraints, the network-wide capacity figure becomes unreliable.
Consistent definitions support better stock transfers, demand routing, workload balancing, and resource allocation.
4. Reporting Takes Longer Than It Should#
When every location submits data in a different format, head office must reconcile the information before it can produce a consolidated report.
Employees may need to:
Request missing reports from site managers
Check formulas and definitions
Convert units and date formats
Remove duplicate transactions
Investigate unusual values
Reconcile conflicting totals
Prepare a final spreadsheet for leadership
This manual work delays decisions and creates additional opportunities for errors.
Automated multi-site reporting can reduce repetitive consolidation, but automation only becomes dependable when the underlying KPI rules are agreed and implemented correctly.
5. Performance Targets Become Unfair#
A business may establish a network-wide productivity target of 100 completed lines per labour hour.
However, if one warehouse includes partial picks and another counts only completed orders, the target does not represent the same level of performance.
Employees and site managers may be judged against inconsistent standards.
This can reduce confidence in performance reviews and create resistance to central reporting initiatives.
A standardised framework should define both the calculation method and the context in which a target is applied. Where facilities have legitimate differences in operating conditions, targets can be adjusted transparently without changing the underlying KPI definition.
6. Leadership Loses Confidence in Operational Data#
Perhaps the most serious consequence is a loss of trust.
When managers repeatedly discover that figures change between reports, they begin questioning every dashboard.
They may return to phone calls, local spreadsheets, and informal updates because they trust the person managing the site more than the consolidated data.
A reporting system loses value when its users do not believe its numbers.
The objective of multi-site operational visibility is not simply to display more information. It is to give decision-makers a consistent, traceable view of what is happening across the network.
How to Standardise KPI Calculations Across Multiple Sites#
KPI standardisation should be treated as an operational and data-engineering project, not just a dashboard redesign.
The following framework provides a practical starting point.
Step 1: Create a Complete Inventory of Existing KPIs#
Begin by documenting every KPI currently used across the organisation.
Include metrics from:
ERP reports
Warehouse management systems
Manufacturing systems
SCADA and equipment monitoring
Transport management platforms
Shift reports
Excel spreadsheets
Local databases
Record the KPI name, site, current formula, data source, reporting frequency, owner, and intended business purpose.
This exercise often reveals that different facilities use several versions of the same metric.
It may also reveal that identical labels are being used for different operational measurements.
Step 2: Establish One Agreed Definition for Each KPI#
Every shared KPI should have a documented definition.
A useful KPI specification should include:
KPI name and business purpose.
Exact calculation formula.
Numerator and denominator definitions.
Included and excluded events.
Required source fields.
Unit of measurement.
Reporting period and timezone.
Refresh frequency.
Responsible data owner.
Validation and exception rules.
For example, an organisation might define order fulfilment rate as the percentage of eligible customer orders completely fulfilled within a specified reporting period.
It must then define what qualifies as an eligible order, what constitutes complete fulfilment, and which date determines the reporting period.
The purpose is to remove interpretation from routine reporting.
Step 3: Map Local Data Fields to a Common Data Structure#
Different systems may use different field names for the same operational event.
One WMS might record picked_qty, another might use confirmed_quantity, and a locally developed database might use a completely different structure.
A standardisation layer maps these local fields into a common data model.
For example:
| Common field | Possible local source fields |
|---|---|
| Site ID | Facility code, warehouse ID |
| Order ID | Sales order, outbound reference |
| Completed quantity | Pick-confirmed quantity |
| Dispatch timestamp | Goods issue time, departure event |
| Downtime duration | Machine stop duration |
| Inventory quantity | Available stock, physical quantity |
The mapping must account for the meaning of each field, not just its name.
This is especially important when connecting multiple ERP, WMS, SCADA, or legacy systems.
Step 4: Build Centralised Calculation Logic#
Once the data has been mapped, shared KPI calculations can be implemented in a central calculation engine.
Instead of allowing every site to calculate a metric independently, the standardisation layer applies the agreed formula to data from each location.
This makes it easier to manage formula changes, validate calculations, and maintain consistent reporting.
Local systems can continue supporting site-specific workflows. The consolidated visibility platform applies the agreed network-level rules when comparing performance.
Step 5: Validate the New KPIs Against Existing Reports#
Do not immediately replace every existing report.
Run the standardised calculations alongside current site reports for an agreed validation period.
Investigate differences by checking:
Missing or duplicate transactions
Incorrect field mappings
Different event timestamps
Unusual exclusion rules
Unit conversion errors
Incomplete source data
Incorrect shift boundaries
The objective is not to force every new number to match the old report. It is to understand why the figures differ and confirm that the new calculation follows the agreed business definition.
Site managers and operational owners should review the results before the new KPI framework becomes the reporting standard.
Step 6: Monitor Data Quality and Calculation Changes#
KPI standardisation is not a one-time exercise.
Source systems change. New facilities join the network. Workflows evolve. A business may introduce a new production line or change its order fulfilment process.
Each change can affect KPI calculations.
Businesses should therefore establish ownership for KPI definitions and monitor:
Missing source data
Duplicate records
Unexpected value changes
Failed integrations
Delayed data updates
Changes to source-system fields
Formula and mapping versions
A documented change-control process helps ensure that all sites continue using the same approved calculation rules.
Examples of KPIs That Need Consistent Calculation Rules#
The most useful KPIs depend on the industry and operating model. However, several measurements commonly require standardisation across multi-site networks.
Manufacturing: Overall Equipment Effectiveness (OEE)#
OEE combines availability, performance, and quality.
OEE = Availability × Performance × Quality
Each component needs an agreed definition.
For example, facilities must align on how planned downtime is treated, how ideal cycle time is determined, and which products or units count as good output.
Without these rules, comparing OEE across manufacturing plants can produce misleading conclusions.
Warehousing: Picking Productivity#
Picking productivity is commonly expressed as completed picks or lines per labour hour.
The organisation must define what counts as a completed pick, how cancelled or reversed picks are treated, and which labour hours are included.
Some facilities may have different order profiles or picking methods. Those differences should be documented so management can interpret productivity figures in context.
Logistics: On-Time Delivery#
On-time delivery measures whether a delivery meets its agreed time commitment.
A standard definition should specify:
The delivery commitment timestamp
The event that confirms delivery
The accepted tolerance window
Treatment of customer-requested changes
Treatment of carrier or operational exceptions
Timezone and calendar rules
Otherwise, one depot may report better delivery performance simply because it uses a more flexible definition.
Inventory: Inventory Accuracy#
Inventory accuracy compares recorded inventory with verified physical inventory.
The business should define the counting method, measurement unit, tolerance threshold, treatment of stock in transit, and timing of the comparison.
This is particularly important when multiple facilities share inventory or transfer stock between locations.
Operations: Capacity Utilisation#
Capacity utilisation compares actual usage against available capacity.
The denominator must be consistent. Does available capacity mean theoretical maximum capacity, planned capacity, or currently usable capacity after maintenance and staffing constraints?
Different definitions can create substantially different utilisation percentages.
Why a Central Dashboard Alone Cannot Fix KPI Inconsistency#
A common response to reporting problems is to introduce a new dashboard.
A central dashboard can improve access to information, but it cannot automatically correct inconsistent source data or calculation rules.
If five facilities submit five different definitions of throughput, placing all five figures on one screen simply makes the inconsistency more visible.
Effective multi-site operational visibility requires several connected capabilities:
Data consolidation: Information from different facilities must be collected from their existing systems and transformed into a common structure.
KPI standardisation: Agreed calculation rules must be applied consistently across every relevant site.
Data validation: Missing records, duplicates, unusual values, and integration errors must be identified.
Reporting visibility: Managers need a consolidated network view with the ability to investigate individual facilities.
Operational context: Users should be able to understand reporting periods, data freshness, exceptions, and site-specific conditions.
The dashboard is the final visibility layer. The reliability of its information depends on the integration, standardisation, and validation processes behind it.
How Multi-Site Operational Visibility Makes Performance Comparisons More Reliable#
A well-designed multi-site operational visibility system connects information from different facilities without requiring every location to use identical software.
This is important for organisations that have grown through expansion, acquisition, or independent site development.
One facility may use SAP, another a different ERP, and another a custom WMS or spreadsheet-based tracking process. Replacing all these systems may be expensive and operationally disruptive.
A connecting layer offers another approach.
The architecture typically includes four layers:
1. Data sources: Existing ERP, WMS, SCADA, databases, spreadsheets, and operational applications provide the source information.
2. Consolidation and standardisation: Data is extracted, mapped, transformed, validated, and processed using agreed KPI definitions.
3. Visibility: A unified dashboard displays operational KPIs, inventory positions, capacity, backlogs, and exceptions.
4. Executive and decision layer: Regional managers and leadership use the consolidated information to compare facilities, investigate issues, and coordinate resources.
This approach makes it possible to maintain local operational systems while establishing consistent network-wide reporting.
It also creates an opportunity to track data latency as a performance measure in its own right. Managers should know whether a dashboard reflects current activity or information that has not been refreshed for several hours.
How Novark Labs Helps Businesses Solve Multi-Site KPI Inconsistency#
For a business operating several warehouses, manufacturing plants, logistics depots, or industrial facilities, the challenge is rarely limited to collecting data.
The real challenge is making information from different sites comparable and useful.
Novark Labs designs and builds custom multi-site operational visibility systems that connect existing facility-level systems into a unified reporting environment.
Rather than assuming every site uses identical technology, the approach is designed to accommodate different ERP platforms, WMS installations, SCADA environments, local databases, and spreadsheet-based processes.
The goal is to establish a reliable connection between local operational activity and network-wide decision-making.
KPI Standardisation Engines#
Novark Labs builds KPI calculation engines that map local data fields to common definitions and apply consistent formulas across facilities.
This supports meaningful comparison of throughput, OEE, pick rate, fill rate, dock dwell time, and other operational indicators.
Cross-Site Data Consolidation#
Data pipelines connect to existing systems at each location, transform source information into a common structure, and consolidate it for reporting.
This approach helps businesses avoid unnecessary replacement of their existing ERP or WMS investments.
Unified Network Operations Dashboards#
Regional managers and executives can view consolidated performance, inventory, capacity, and operational exceptions in one interface.
Site-level drill-down provides additional context when a network-wide figure requires investigation. For warehouse-specific views, see Novark's Warehouse Visibility & KPI Dashboards.
Automated Executive Reporting#
Automated reporting can replace repetitive requests for individual site spreadsheets and manual consolidation.
Reports can be generated on agreed schedules using the consolidated data, helping management spend less time preparing reports and more time acting on the information. Learn more about Operational Reporting Automation.
Multi-Site Coordination#
Operational visibility can extend beyond reporting.
Structured workflows can support stock transfer requests, shared resource scheduling, and cross-site exception escalation, giving participating facilities a clearer view of requests and commitments.
For organisations that want to improve reporting consistency without replacing their core systems, this engineering-led approach provides a practical path forward.
Explore the Novark Labs Multi-Site Operational Visibility Systems page to understand how a standardised operational layer can connect distributed facilities.
What Should Businesses Look for in a Multi-Site KPI Standardisation Solution?#
Before selecting a platform or commissioning a custom system, evaluate whether the proposed solution addresses the underlying calculation problem.
A suitable solution should support:
Different source systems: Can it connect to the ERP, WMS, SCADA, databases, and spreadsheets already used across your facilities?
Central KPI definitions: Can the organisation manage shared formulas and definitions in one controlled framework?
Site-level flexibility: Can local workflows remain operational while network-wide reporting follows common rules?
Data validation: Can it identify missing, duplicated, delayed, or inconsistent source records?
Transparent calculations: Can users understand how a KPI was produced and which source fields contributed to it?
Reporting freshness: Can managers see when the underlying information was last updated?
Network and site views: Can leadership compare facilities while supervisors investigate local operational details?
Future scalability: Can additional sites and systems be integrated without rebuilding the entire reporting environment?
A dashboard that only displays charts may not meet these requirements. Look for a solution that addresses data integration, calculation logic, validation, and operational visibility together.
Conclusion: Consistent KPI Rules Are the Foundation of Reliable Multi-Site Visibility#
When different facilities report different values for the same KPI, the problem is not always operational performance. Sometimes, it is the way performance is measured.
Different formulas, source systems, reporting periods, and exclusion rules can create misleading comparisons. Management may rank sites incorrectly, allocate resources inefficiently, or spend hours reconciling reports that should already be comparable.
The answer is not simply to put every facility's numbers on one dashboard.
Businesses need a shared KPI framework, a consistent calculation engine, reliable data integration, and clear reporting rules. These foundations make cross-site benchmarking more meaningful and help leadership distinguish genuine performance differences from calculation inconsistencies.
For organisations operating multiple warehouses, manufacturing plants, logistics depots, or industrial facilities, multi-site KPI standardisation is an important step towards dependable operational visibility.
Novark Labs builds custom visibility systems that connect existing operational platforms, standardise KPI calculations, and bring facility-level information into a unified network view.
If your sites use different reporting rules and management cannot confidently compare their performance, consider starting with a review of your current KPI definitions and data sources.
Explore Novark Labs Multi-Site Operational Visibility and request an operational visibility assessment to identify where inconsistent calculations are affecting your network.